Qinghua Yan1,2,
Huili Mao2,
Yanming Wei1 ![]()
For correspondence:- Yanming Wei Email: weiym@gsau.edu.cn Tel:+863733831928
Received: 5 December 2016 Accepted: 23 February 2017 Published: 31 March 2017
Citation: Yan Q, Mao H, Wei Y. Elucidation of mechanism of Si-jun-zi decoction-induced reversal of spleen deficiency syndrome in rats by LC-Q-TOF/MS metabolomics. Trop J Pharm Res 2017; 16(3):525-533 doi: 10.4314/tjpr.v16i3.5
© 2017 The authors.
This is an Open Access article that uses a funding model which does not charge readers or their institutions for access and distributed under the terms of the Creative Commons Attribution License (http://creativecommons.org/licenses/by/4.0) and the Budapest Open Access Initiative (http://www.budapestopenaccessinitiative.org/read), which permit unrestricted use, distribution, and reproduction in any medium, provided the original work is properly credited..
Purpose: To explore the therapeutic effect and mechanism of action of Si–jun–zi decoction (SJZD) in rat spleen deficiency syndrome.
Methods: Spleen deficiency syndrome was induced in a rat model with reserpine. Liquid chromatography quadrupole time-of-flight mass spectrometry (LC-Q-TOF/MS) and partial least squares-discriminate models (PLS-DA) were used to analyze the difference in global metabolite profile within all groups. Variable importance projection (VIP > 1) and Student’s t–test (p < 0.05) were used for biomarker selection.
Results: Enzymatic results showed that the level of amylase (AMY), pepsin (LPS) and pepsase were significantly lower in the untreated rats than in normal control rats and SJZD group rats (P < 0.05). Histopathological analysis showed there were significant pathological changes in the untreated rats compared with the normal control group and SJZD group rats. PLS-DA score plots of the untreated group rats clustered separately from control rats, whereas SJZD group rats clustered closely to normal control rats. Twenty potential biomarkers, including phospholipid and fatty acids, were screened. The relative content of 20 metabolites showed significant differences in the untreated group compared with control and SJZD groups (p < 0.05). Six potentially perturbed metabolic pathways were found, which might be potential targets pathways for SJZD intervention in spleen deficiency syndrome.
Conclusion: Metabolomics approach is an effective tool for understanding the therapeutic mechanisms of SJZD
Introduction
Spleen deficiency syndrome is a common disease syndrome treated in traditional Chinese medicine (TCM) practice that causes patients to suffer from poor health and fatigue. It comprises a comprehensive set of pathological changes that reduce the function of multiple organs and systems based on the abating function of digestion and nutrient absorption [1]. Si–jun–zi decoction (SJZD), a classic traditional Chinese medicine, has been proved to have positive effects on spleen deficiency syndrome. However, there are very few reports dealing with the therapeutic mechanisms of SJZD on spleen deficiency syndrome using a modern scientific strategy.
Metabolomics, an emerging field of systems biology, is a strong analytical tool because of its high-throughput quantification ability for monitoring the levels of multiple endogenous metabolites, closely related to physiological and pathological processes [2]. Changes in levels of endogenous metabolites provide important information that can be used for early diagnosis, for studies on pathogenesis, for studies on potential therapeutic targets [3], and for the evaluation of the therapeutic and toxic effects of drugs [2]. Currently, liquid chromatography mass spectrometry (LC-MS) technology has been used as an important tool in metabolomics research due to its high resolution, high sensitivity, and a wide range of mass [4].
In the study, a metabolomics approach based on LC-Q-TOF/MS with pattern recognition was used to identify changes in the levels of different metabolites in plasma samples from rats with spleen deficiency syndrome. A statistical analysis approach was applied to discover potential biomarkers and uncover the key pathways that were deregulated in spleen deficiency syndrome.
Methods
Apparatus
Micro-imaging system (Olympus, Tokyo, Japan). An Agilent 1290 Infinity LC system coupled to an Agilent 6538 UHD Q-TOF/MS (Agilent Corporation, USA). An Acquity LC HSS T3 column (2.1×100 mm, 1.8 µm, UK).
Chemicals and reagents
HPLC grade acetonitrile was purchased from Merck (Darmstadt, Germany). Reserpine injection (batch No. 1411291) was from Guangdong Bangmin Pharmaceutical Co., Ltd. (Jiangmen, PR China). Atropine sulfate (2mL: 1 mg, batch no. 140338005B) and physiological saline (batch no. WF111109) were from Anyang jiuzhou Pharmaceutical Co., Ltd. (Anyang, Henan, PR China). Codonopsispilosula (Franch.) Nannf. (Batch No. 401004713), Atractylodesnmacrocephala (batch No. 002010401), Poriacocos (Schw.) wolf (batch No. 002010301), and GlycyrrhizauralensisFisch (batch No. 003030601) were provided by Tongrentang of Beijing. SJZD composed of Codonopsispilosula (Franch.) Nannf, Atractylodesmacrocephala, Poriacocos (Schw.) Wolf, and GlycyrrhizauralensisFisch at a ratio of 2:2:2:1 through water decoction for two times, then the decoction was concentrated (equivalent of crude drug concentration of 2 g/mL). AMY, LPS and lipase assay kits were obtained from Nanjing Jiancheng Bioengineering Institute (Nanjing, PR China).
Spleen deficiency syndrome model and drug administration
All procedures that involved animals were conducted in accordance with the National Institute of Health Guide for the Care and Use of Laboratory Animals [5]. All animal experiments were approved by Ethics Committee of Xinxiang Medical University (ref no. LLZM2014528). Forty male Sprague-Dawley rats (180 – 220 g); (rodent license no. SCXK 20100002) were supplied by Laboratory Animal Center of Henan Province (Zhengzhou, PR China).
After acclimatization, the rats were randomly divided into four groups: normal control group (NC) (n = 10), the spleen deficiency syndrome model group (M) (n = 10), model rats treated with SJZD group (SJZD) (n = 10) and the model rats treated with atropine sulfate injection group (PC) (n = 10). Rats in the M, SJZD and PC groups were subcutaneously injected with 0.5 mL reserpine injection (0.1 mg/mL) in subcutaneous injection, while the NC group were injected an equivalent volume of 0.9 % saline once a day. Then the rats in SJZD group were given SJZD via gavage once a day (20 g/kg/d). The rats in PC groups were injected with atropine sulfate using subcutaneous injection mothed (0.5 mg/kg/d); the NC group was injected equal volume of 0.9% saline once a day. All rats were continually treated for 14 days.
Sample collection and pretreatment
After 14 days, forty rats were anesthetized with 10 % chloral hydrate following an overnight fast and two aliquots blood samples from the abdominal aortic were collected in heparinized and non-heparinized tubes, respectively. The whole blood of one aliquot in non-heparinized tubes was centrifuged at 3000 g for 10 min at 4 °C to get the serum sample. The serum supernatant was immediately subjected for determination of AMY, LPS and pepsase activity using the assay kits. Another aliquot of the blood sample collected in heparinized tubes was centrifuged at 3000 g for 10 min at 4 °C to get the plasma samples.
The plasma samples were immediately stored at -80 °C until metabolomic analysis. At the same time, stomach samples were fixed with 10 % poly-formaldehyde, embedded in paraffin, sectioned, stained with hematoxylin-eosin, and analyzed microscopically at 100× magnification for histopathological observation. Plasma sample for LC-Q-TOF/MS analysis was prepared by protein precipitation with ice-cold acetonitrile.
LC-Q-TOF/MS analysis
Acetonitrile (A) and water (B) were used as the mobile phases, with a gradient elution of 95 % B 0 – 10 min, 80 % B at 10 – 15 min, 50 % B at 15 – 23 min, 5 % B and 23 – 35 min. The flow rate and the injection volume were 0.25 mL/min and 5µL, respectively.
Mass spectroscopy was performed using a full scan mode from m/z 50 to 1200 for 35 min (positive and negative modes). The following MS analytical parameters were employed: nebulizer pressure, 45 psig; capillary voltage, 3.5 kV; drying gas flow of 11 L/min; fragmentor voltage 120 V and gas temperature of 350 °C.
Ten pooled quality control samples were injected before the analysis of two ion modes. The pooled quality control samples were injected at intervals of five samples during the whole experiment to further ensure the repeatability and stability of the analysis.
Potential biomarkers and metabolic pathway analysis
PLS-DA analysis and statistical analysis method were used to extract potential biomarkers based on the variable importance in the projection (VIP value >1) and Student’s t-test (p value < 0.05) between NC and M group. The selected potential biomarkers were identified by comparing databases according to the accurate molecular masses. Databases of KEGG (http://www. genome.jp/kegg/), MassBank (http://www. massbank.jp/), LIPID MAPS (http:// www.lipidmaps.org/) and HMDB (http://www.hmdb.ca) were used in the study. MetaboAnalyst 3.0 (http://www.metaboanalyst.ca) was used to perform metabolic pathway analysis.
Statistical analysis
The raw LC-Q-TOF/MS data were transformed by MS Convert software, and R software was used for peak detection, deconvolution and alignment. The data were transformed into a single matrix containing with the retention time-m/z pairs, normalized ion intensities and sample names, and then statistical analysis were performed through SIMCA-P+ software (version 11.0; Umetrics AB, Umea, Sweden) and SPSS software (version 13.0; Beijing Stats Data Mining Co. Ltd, Beijing, PR China). P < 0.05 was considered significant.
Results
Enzyme activity
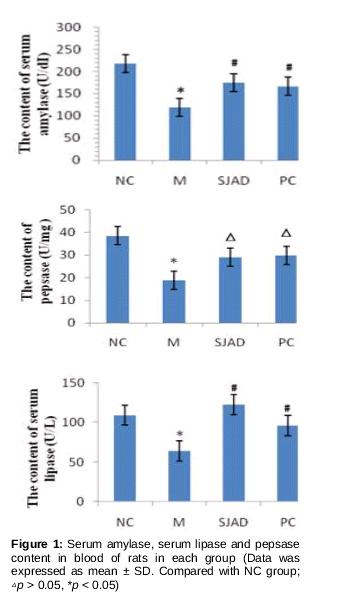
AMY was assayed based on iodine - starch colorimetric method and LPS and pepsase were assayed based on colorimetric method. As shown in , the levels of AMY, LPS and pepsase were significantly lower in model rats with spleen deficiency syndrome than in normal control rats (p<0.05). Rats in the PC group (rats treated with atropine sulfate) and SJZD group (model rats treated with SJZD), had higher levels of AMY, LPS and pepsase than model rats (p<0.05). There was no significant change in the levels of AMY, LPS and pepsase between rats in the PC group and SJZD group (p > 0.05), or normal control rats. These results revealed that SJZD treatment in rats with spleen deficiency syndrome was effective.
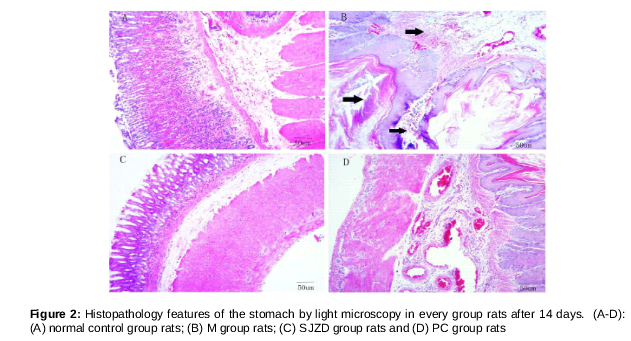
Histopathological analysisIn comparison with control rats, rats with spleen deficiency syndrome exhibited numerous pathological changes in the tissues. These changes included disordered arrangement of gastric mucosal glands, obscure structures, partial gland atrophy, inflammatory exudate, slight hyperemia and edema in the interstitial tissue, and increased gastric epithelial cell mucus secretion (as shown in figure with the arrow). Histological features of the stomach tissues of the SJZD group rats, and the PC group rats were normal, similar to the tissues of the NC group rats ().
Repeatability and stability of LC-Q-TOF/MS analysis method
Quality control analysis was carried out to assess the repeatability and stability of the LC-Q-TOF/MS analysis method, using a pooled quality control sample injected at intervals of five samples (n = 5). The relative standard deviation of retention time was in the range of 0.05 – 0.15 % for the positive ion mode, and 0.02 – 0.11 % for the negative ion mode. The relative standard deviation of the peak intensity varied between 1.38 and 4.48 % for the positive ion mode, and between 1.75 and 6.53 % for the negative ion mode. These results show that our LC-Q-TOF/MS analysis method had excellent repeatability and reliability.
LC-Q-TOF/MS results for metabolic profiling
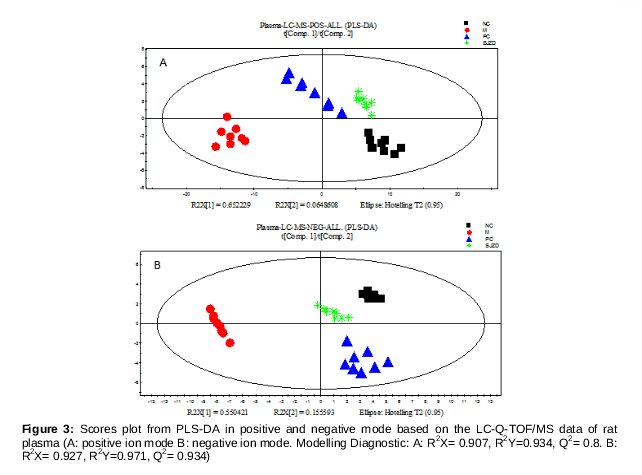
The plasma samples of the experimental rats were analyzed by LC-Q-TOF/MS in both positive and negative ion modes. PLS-DA method was used with the LC-Q-TOF/MS data to reveal alterations of the basal metabolite profile between different groups. The results of PLS-DA analysis and the corresponding score plots (both in positive ion and negative ion modes) are shown in . Plasma samples from untreated rats with spleen deficiency syndrome were clearly separated from control rats in the score plots. This shows that the normal plasma metabolic profile was remarkably disturbed due to the spleen deficiency syndrome. Plasma samples from untreated rats treated with SJZD, and from rats in the positive control group, clustered together with those of control rats, indicating that both drugs had a positive influence on spleen deficiency syndrome. These data also indicated that SJZD has a therapeutic effects, in agreement with histopathological and enzyme activity observations.
Identification of metabolites
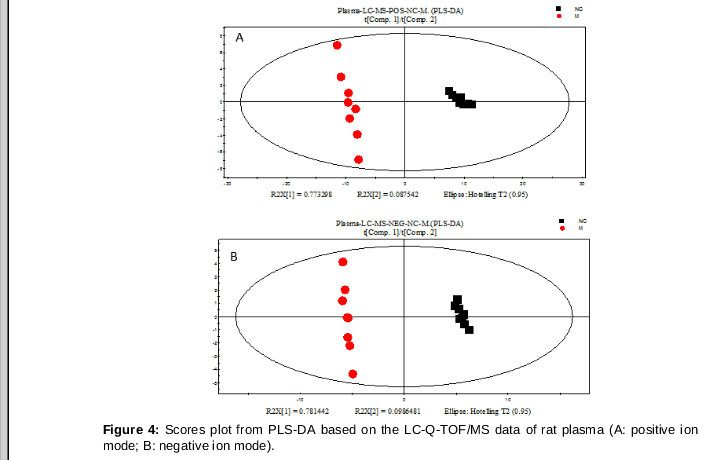
Important compounds and metabolic pathways related to spleen deficiency syndrome were studies by plasma metabolic profiling. Metabolite differences between normal rats and rats with spleen deficiency syndrome were analyzed using PLS-DA technique (). Values of the parameter R2Y of positive ion mode and negative ion modes were 0.993 and 0.998, respectively. This indicates that the technique for analysis could differentiate metabolites from untreated rats and those control rats. The values of the parameter Q2 in the positive ion mode and the negative ion mode were 0.989 and 0.997, respectively. This indicates that our technique for analysis has a strong predictive performance.
A VIP value was obtained for each metabolite identified and ranked by its individual contribution to the statistical discrimination [6]. Based on comparison of the PLS-DA metabolic profiles between the model rats and control rats, on the VIP > 1.0, and on the p < 0.05 (estimated by Student’s t–test). Twenty potential biomarkers (six in the negative ion mode and ten in the positive ion mode) were screened. These metabolites are listed in (a) and (b). shows thirteen metabolites with decreased levels in model rats (relative to control rats), and seven metabolites with increased levels in untreated rats (relative to control rats).
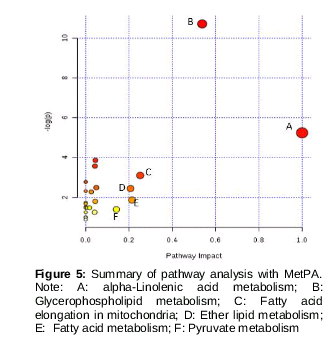
Metabolic pathway analysis of potential biomarkers
Further analysis of the pathways affected in the rats with spleen deficiency syndrome was performed with MetaboAnalyst. The 21 potential biomarkers were imported to MetaboAnalyst, and the pathways potential biomarkers concerned were presented. As shown in , the pathways where the impact value was greater than 0.1 were considered as potential target pathways. At last, six pathways were selected. They were as follows: alpha-linolenic acid metabolism, glycerophospholipid metabolism, fatty acid elongation in mitochondria, ether lipid metabolism; fatty acid metabolism, pyruvate metabolism.
Discussion
SJZD is a famous traditional Chinese medicine that has gained general attention in recent years due to its extensive distribution and potential biological functions. In this study, the analysis of serum enzyme activities and his top athological analysis revealed protective effects of SJZD. These results were consistent with the results of our metabolomics analysis. Our findings clearly indicate that SJZD improved the condition of rats with spleen deficiency syndrome.
The metabolomics analysis conducted in this study revealed that phospholipid and fatty acids could be potential biomarkers for spleen deficiency syndrome. Specifically, abnormalities in phospholipid metabolism are important causes of pathogenesis in spleen deficiency syndrome. The pathophysiological role of sphingolipids has also gained great attention. Phospholipids are important structural components of biological membranes, and it is largely divided into two categories: phosphoglyceride and sphingomyelin. Phosphoglyceride can be divided into different categories according to different functional groups, such as phosphatidylcholine, sphingomyelin, or phosphatidylethanolamine. Glucosylceramide, phosphatidylcholine (16:0/22:4(7Z,10Z,13Z,16Z)), lysophosphatidyl-choline (O-18:0), phosphatidylethanolamine (22:2(13Z,16Z)/16:0), phosphatidylcholine 20:4(5Z,8Z,11Z,14Z)/20:3(8Z,11Z,14Z)), sphin-gomyelin (d18:1/18:0), phosphatidylcholine (18:0/20:3(5Z,8Z,11Z)), all belong to the sphingolipid family. Lysophosphatidylcholines, also called lysolecithins, are formed through phosphatidylcholine hydrolysis by the enzyme phospholipase A2, and are a class of phospholipids derived from phosphatidylcholines [7]. Lysophosphatidylcholines activates protein kinase C and make vascular smooth muscles contract through Ca2+-dependent or Ca2+-non-insulin dependent pathways. At the same time, inhibition of endothelium-derived nitric oxide, or the release or inactivation of endothelial hyperpolarization factor influences endothelial-dependent relaxing, leading to endothelial-dependent muscle contraction [8]. In this study, lysophosphatidylcholine (O–18:0) was up-regulated in rats with spleen deficiency syndrome, relative to control rats. This result is consistent with the analysis of Shi et al [9], which considered that an increased level of plasma lysophosphatidylcholines was a marker of cell membrane injury. Previous studies showed that lysophosphatidylcholine increases in response to reactive oxygen species and inflammatory conditions [10]. According to the saturation and the length of their acyl chains, lysophosphatidylcholine species exhibit differential abilities to induce the expression of cyclooxygenase-2 and prostaglandin [11]. Therefore, the increase of lysophosphatidylcholines (O–18:0) increase prostaglandin E2 levels in the plasma of rats with spleen deficiency syndrome. However, the relationship between plasma levels of lysophosphatidylcholines and spleen deficiency syndrome are not known, which will be the subject of more in-depth study.
It has been reported that excessive free fatty acids may result in increased production of reactive nitrogen species and of reactive oxygen species, and subsequent oxidative stress [12]. In this study, the contents of free fatty acids in the plasma of rats with spleen deficiency syndrome were higher than those of normal control rats, rats in the positive control group, or model rats treated with SJZD. These higher values may be due to enhanced lipid metabolism (especially ω-oxidation) and to a reduction in the corresponding circulating lipid levels [13]. The restoration of proper free fatty acids levels could be one of substance basis of the regulatory and therapeutic role of SJZD.
Alpha-linolenic acid is a member of the group of ω-3 fatty acids. It cannot be synthesized in the mammalian body, and must be provided in the diet. Alpha-linolenic acid and other ω-3 fatty acids regulate the expression of a number of genes, including those involved in fatty acid metabolism and in inflammation. Alpha-linolenic acid is usually oxidized by many factors, including free radicals [14]. In this study, excessive free radicals induced by spleen deficiency syndrome stimulated alpha-linolenic acid oxidation, resulting in decreased plasma levels of alpha-linolenic acid in rats with spleen deficiency syndrome. SJZD exhibited antioxidant activity and inhibited alpha-linolenic acid oxidation, thus increasing alpha-linolenic acid levels in model rats treated with SJZD, relative to model rats with spleen deficiency syndrome.
From the analysis of the plasma endogenous metabolites and the related metabolic pathways using an online metabolic network analysis tool. We speculate that alpha-linolenic acid metabolism, glycerophospholipid metabolism, fatty acid elongation in mitochondria, ether lipid metabolism, fatty acid metabolism, pyruvate metabolism were related to spleen deficiency syndrome. The six pathways were disturbed in the rats with spleen deficiency syndrome because of the level changes of the related potential biomarkers. These disturbed pathways were partly recovered towards healthy state in the SJZD group rats via SJZD treated on spleen deficiency syndrome rats. Therefore, we speculate that the six metabolic pathways may be the potential target of SJZD treatment spleen deficiency syndrome rats.
Conclusion
In this paper, both pharmacological (serum enzyme activity and histopathological observations) and metabolomics results indicated the good effect of SJZD on spleen deficiency syndrome rats. Six potential target metabolic pathways of SJZD treatment spleen deficiency syndrome rats were screened. Metabolomics approach may be an effective tool for understanding the therapeutic mechanisms of SJZD.
Declarations
Acknowledgement
References
Archives


News Updates